There's a number that shows up in almost every API evaluation conversation: latency. Specifically, p50 or p99 response times, usually measured in a controlled benchmark with a clean query, a warm cache, and nothing else running.
That number gets put in a table, the table gets shared in a Slack thread, someone flags the fastest option, and a decision gets made. Sound familiar?
Then, six months into production, teams start noticing something is off. Answers are coming back fast—but they're not coming back right. Or they're fast in the US and mysteriously slow for users in Frankfurt. Or they're speedy on simple queries and brutally slow the moment the workload gets even slightly complex.
Latency isn’t a bad metric but raw latency, isolated from everything else that makes an API useful in production, tells you almost nothing about what you actually care about.
What Latency Is Actually Measuring
When vendors publish latency numbers, they're usually measuring time-to-first-token or end-to-end response time under ideal conditions: short inputs, clean infrastructure, minimal concurrent load.
That's a useful data point, but may not make the best decision point.
What it leaves out:
- Throughput Under Load: A system that returns results in 400ms for a single request may degrade to 2.5 seconds per request when 50 are running concurrently. Most production workloads aren't single requests. If you're building an AI agent that fans out across multiple tools in parallel, or a search experience that handles thousands of users during peak hours, the number that matters is latency at your actual concurrency profile.
- Latency at Tail Percentiles: P50 latency means half your requests are faster than that number. The other half aren't. For user-facing applications, p95 and p99 are often more operationally relevant.
- Quality-Adjusted Latency: This one rarely gets measured, but it should. If a system returns a result in 300ms and that result is wrong—hallucinated, incomplete, or missing a key document—you haven't saved time. You've shifted the cost downstream, into the human review cycle, the re-query, the escalation. A system that takes 600ms but returns accurate, grounded, complete results every time has a better effective latency in the only sense that matters: how long it takes for the end user to actually get what they need.
- Infrastructure and Geographic Variability: Latency benchmarks are almost always run from a specific cloud region, usually us-east-1 or equivalent. If your users are global, or if your inference infrastructure is distributed, those numbers don't generalize. A 400ms response from Virginia becomes a 900ms response from Singapore without anyone changing a line of code.
The Metric That's Actually Missing: Time-to-Useful-Result
The frame that most teams are missing is a composite. Call it time-to-useful-result: how long does it take, end to end, from user intent to an answer the user can actually act on?
Yes, that composite includes latency. But it also includes:
- Recall and Relevance: Did the system retrieve the right documents or data before generating an answer? A fast response built on incomplete retrieval costs more in human correction time than a slightly slower, accurate one.
- Grounding Rate: For AI search specifically, what percentage of responses are grounded in verifiable sources rather than generated without citation? Ungrounded responses create a downstream verification burden that adds latency invisibly.
- Re-Query Rate: How often does a user—or an automated pipeline—have to ask the same question again because the first answer was insufficient? Every re-query is unbilled latency.
- Integration Overhead: How much time does your team lose to rate limit handling, error recovery, and edge case management? A low-latency API with unpredictable rate limits can be slower in practice than a higher-latency one with clean reliability guarantees.
None of these show up in a benchmark table, but all of them show up in your production logs eventually.
What This Means in Practice
The teams that tend to make good API decisions share a few habits.
- They test at their actual concurrency levels, not the vendor's demo. Before committing to an integration, they run load tests that mirror the peak concurrency they expect in production—not the average, the peak.
- They measure quality alongside speed. This means building even a basic evaluation set: a collection of representative queries with known-good answers, run against every candidate API. The delta between fast-and-wrong and slightly-slower-and-right is usually worth paying for.
- They look at tail latency, not averages. P99 is the user experience for 1% of requests. Depending on your volume, that's still a lot of people. And p99 often reveals architectural issues—cold starts, cache misses, throttling—that p50 completely hides.
- Lastly, they account for the total cost of latency, not just the API's share. When you factor in re-queries, error handling, and downstream processing of incomplete results, the total latency budget looks very different than the vendor's headline number suggests.
A Faster Result Isn't Always a Better Answer
API latency matters. Don't build on something slow when something fast is available. But raw response time is one input into a much more important question: which API actually gets your users to the right answer, reliably, at scale?
That question takes more effort to answer than checking a benchmark table. It also tends to surface the real differences between providers—differences that latency comparisons, on their own, will never show you.
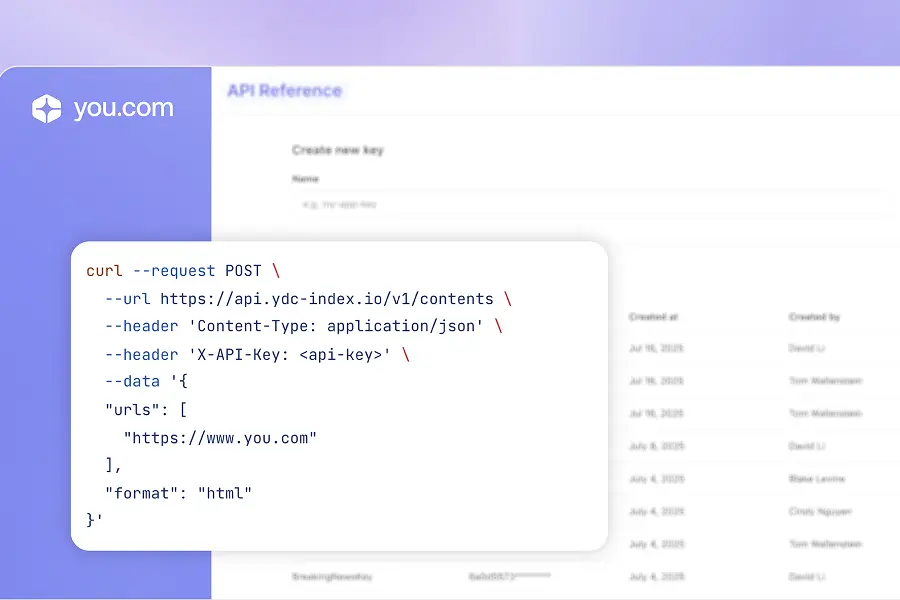
If you're evaluating APIs for AI search or research workflows, the You.com Search and Research APIs are built to be tested rigorously, not just measured quickly. Start with the documentation or book a conversation with the team about your specific workload.


.webp)


.png)